No real-time tracking
Problem
Inventory and condition are not visible as they change; they are reconstructed afterwards from separate records.
Impact
A deviation is discovered at the point it becomes a loss, not at the point it becomes a risk.
Waste Not. Want Not.
A perishable shipment crosses producers, carriers, processors, customs officers, regulators and buyers. Its condition can change in hours; the information that could protect it is split across agencies, records and handoffs. We proposed a shared record, earlier risk and physical traceability.
Improve the digital aspects of food importation into the United States, to reduce food loss.
Roughly forty percent of food produced worldwide is lost or wasted, and much of that loss happens after harvest and during importation — where outdated processes and fragmented systems let perishable goods spoil while everyone involved is doing their job correctly.
I was a project manager on the SCADpro team: running the research, holding the synthesis together, and steering the checkpoints with Deloitte. The deliverables were a team effort across research, design, film and engineering.
Picture a crate of oranges leaving a farm in good condition.
Its location sits in a carrier’s system. Its temperature sits in a sensor log, if anyone is reading one. Its paperwork sits with a broker, its inspection status with an agency, its delivery window with a distributor. Each record is accurate. None of them is complete.
So when a document goes missing or a condition changes, the question is not whether the data exists. It is who can see it soon enough, and who owns the response.
The oranges are a storytelling device from our vision-video work, not a documented shipment or a user test.
Physical condition changes slowly at first, then all at once. The cost of noticing late is the whole shipment.
Location, temperature, paperwork and inspection each live somewhere else, updated on different clocks.

Food does not fail at one screen. Decisions fail when the record and the physical journey drift apart.
We had no standing in this industry, so we went and got some.
Nine subject-matter perspectives — six through Deloitte and government contacts, three sourced independently — across international trade, sustainability, large-scale data, risk modelling, food loss, food safety, farming, customs-port operations and international shipping.
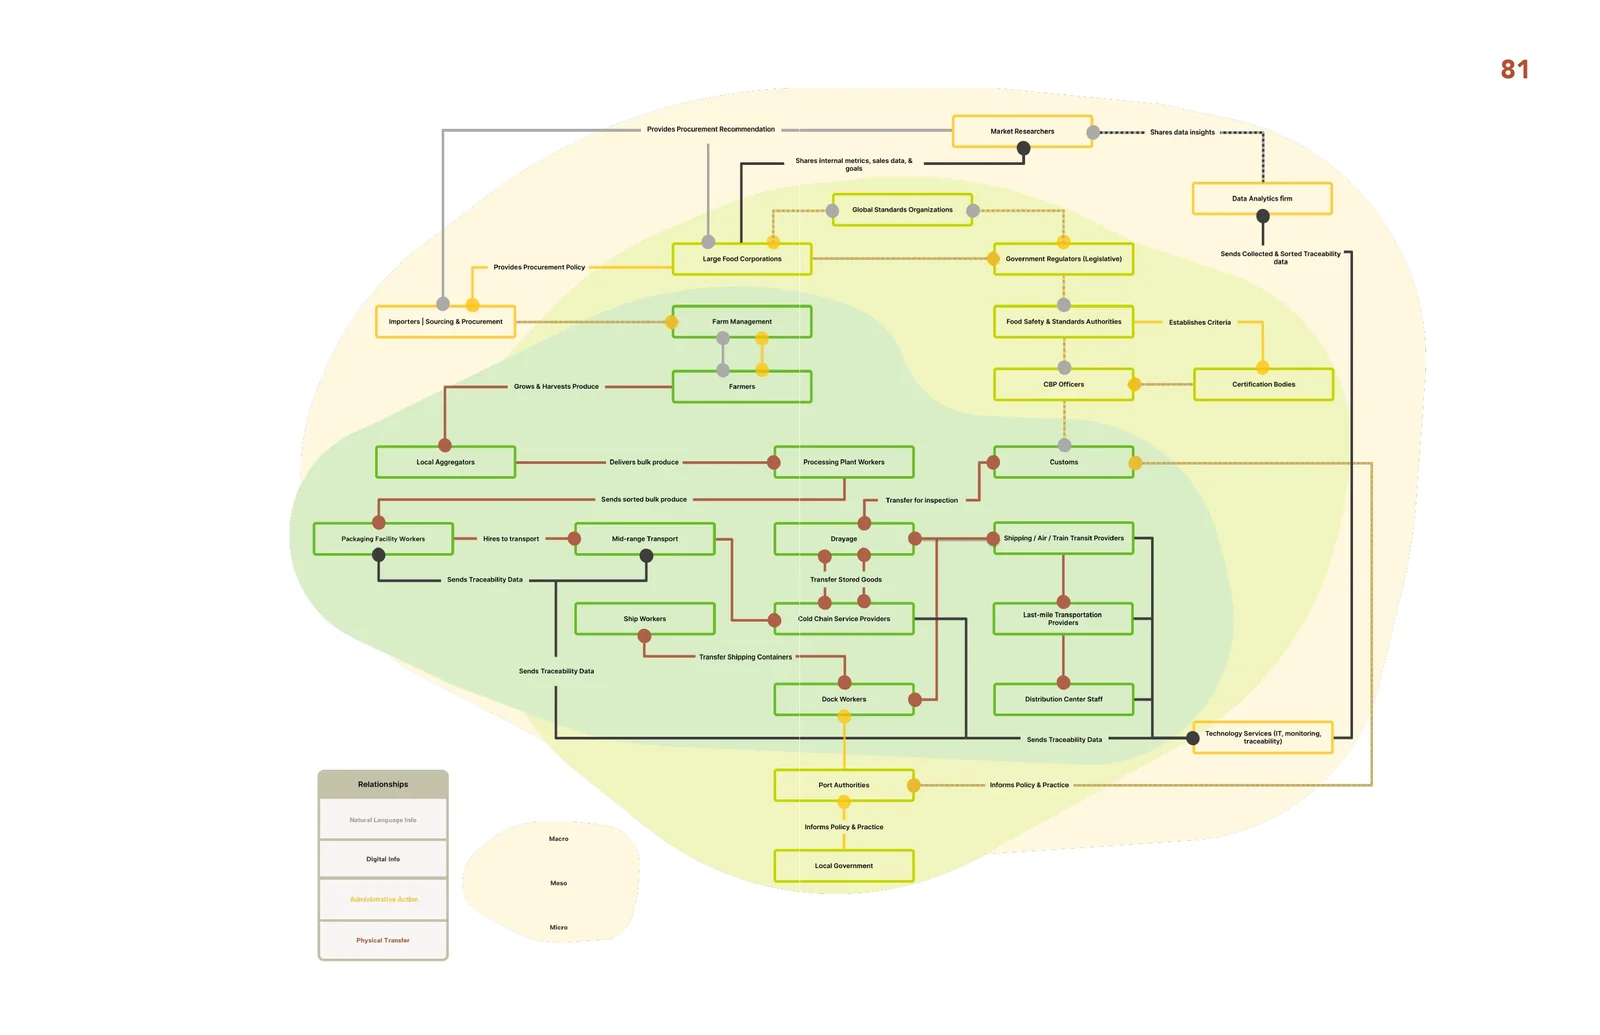
Then we mapped what we heard twice over: a journey map tracing food, people, records and technology from farm to table, and an ecosystem map separating the operators who handle the goods from the intermediaries who service them and the institutions that set the rules.
We also ran forward — five- and ten-year driving forces, plus climate, cyber, geopolitical and supply-chain disruptions — so the proposal would survive the world it would land in.
The book records who we interviewed and their expertise. It does not publish transcripts or attributed quotes, so nothing here is presented as an individual’s words.
Three pain points kept coming back, in every interview and at every stage of the map.
Underneath all three sits the same cause: inconsistent data and documentation between organisations — CBP, FDA, USDA and the private operators who have to satisfy them.
Inventory and condition are not visible as they change; they are reconstructed afterwards from separate records.
A deviation is discovered at the point it becomes a loss, not at the point it becomes a risk.
Shipping and processing delays accumulate across handoffs that nobody owns end to end.
Perishable goods run out of shelf life while the paperwork catches up.
Agencies at the border coordinate through channels that were never designed to carry an urgent, shared decision.
The people who could act are the last to know, and act without the full record.
How might everyone responsible for a perishable shipment work from a record they can trust, see a risk developing early enough, and coordinate a response before the food is lost?
This is regulated infrastructure. Nothing gets to start from scratch.
Whatever we proposed had to coexist with the systems agencies already run, normalise formats that were never meant to meet, and survive the reality of who is allowed to see what.
Adoption was the constraint we could least design our way around. A large barrier to new technology here is resistance to change among the people doing the work, and a lack of visibility into what digitisation would actually improve for them. These were constraints we designed against — not problems we proved we had solved at production scale.
Early ideation was deliberately wide.
A common data library. Blockchain-based traceability. AI risk management. AR maintenance. VR training. Gamified digital-skills training. Each one answered a real part of what we had heard.
At the midterm checkpoint Deloitte pushed back toward three: AI risk management, the data library, and increased traceability — and away from blockchain and AR/VR training. That narrowing is the most consequential decision in the project, and it came from the client reading our research back to us.
Data library · blockchain traceability · AI risk management · AR maintenance · VR training · gamified upskilling
A shared record, earlier risk insight, and physical traceability — three technologies that only work together
Three interconnected pieces could be specified properly in the time we had. Six could only be described. The narrowing bought depth, and depth is what the third checkpoint asked us for.
Four proposed pieces, and the order they work in.
Etērna and SLICE capture what happens physically. The Unified Data Library organises it into one record. PIE reads that record for risk and surfaces the decision. Communication connects the people who can act.
None of them is a cure on its own — which is the point. The proposal is the relationship between them.
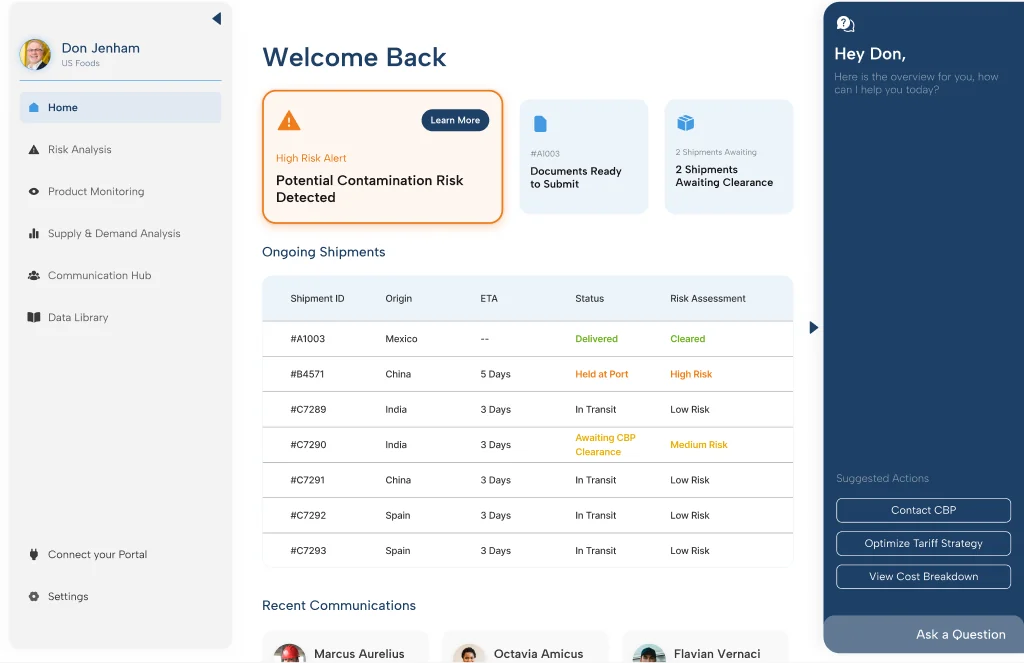
The platform opens on what is wrong, not on a wall of tools.
A role-based home puts a high-risk alert above shipment statuses, recent communications and suggested actions — with the data library as a destination rather than the front door. That ordering is the whole argument of the research, expressed as a layout.
Open the alert and the next screen has one job: make a deviation interpretable. A temperature reading becomes a risk score, a plain-language explanation of what it could cause, and three actions a person can actually take.
The urgent thing is above the fold and one click from its detail. Everything else on the page is context for it.
Shipments, communications and suggested actions sit below the alert. The Data Library is a destination, not the entry point.
A temperature deviation is shown as a score with the reason beside it — what it could cause if nobody acts.
Check the sensor logs, notify food safety, adjust refrigeration. The screen ends in a decision, not a dashboard.
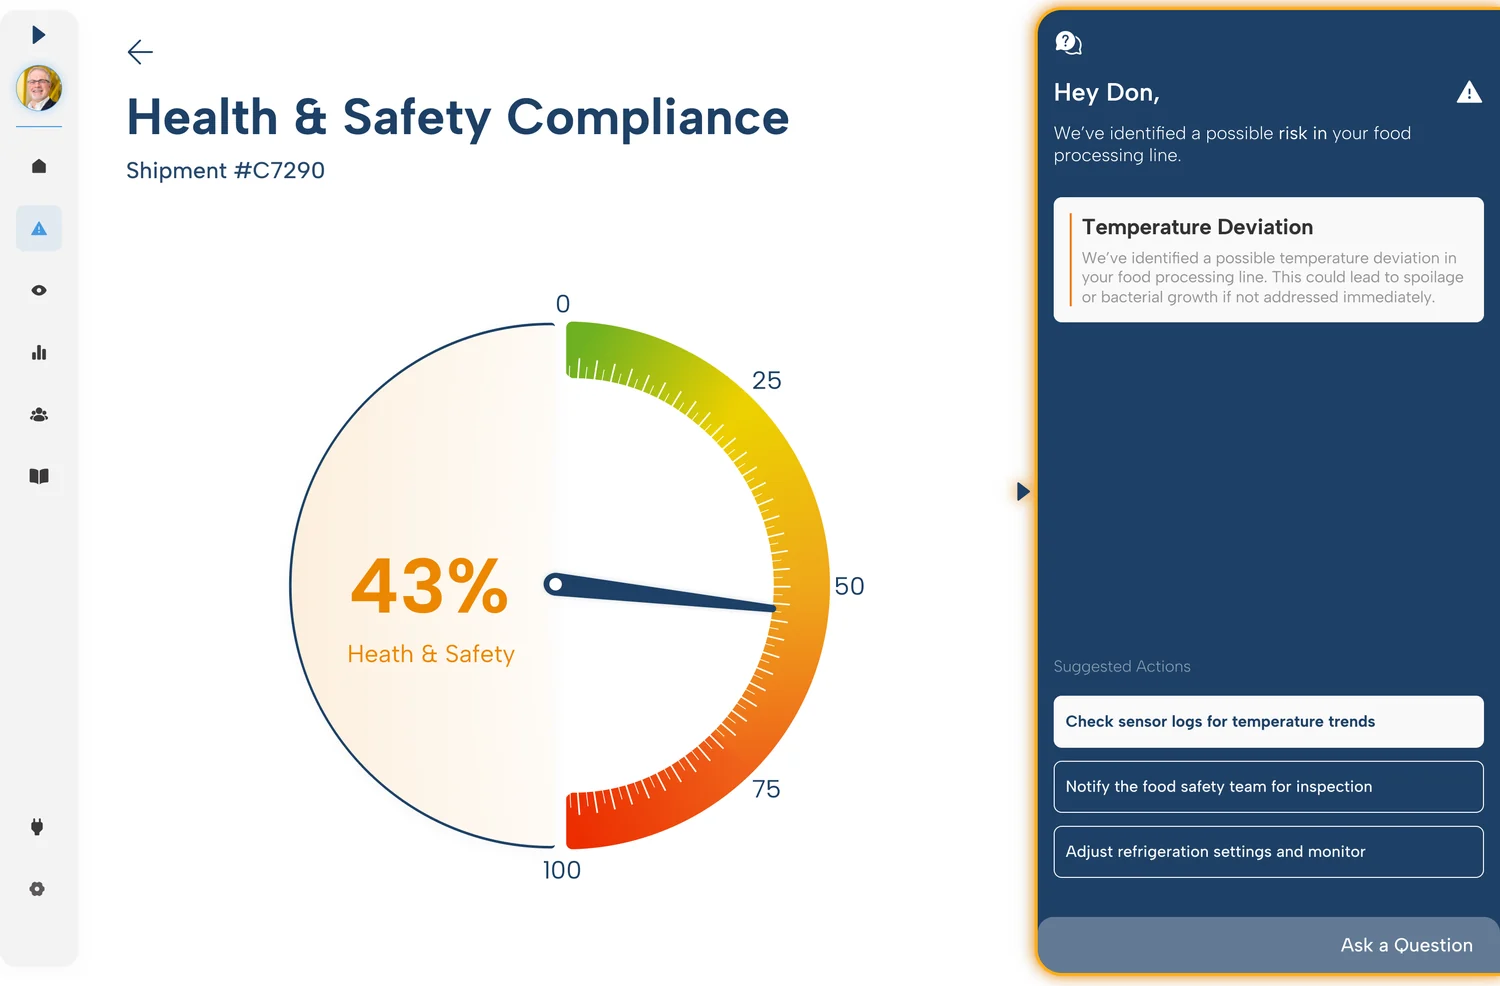
The percentages on these screens are illustrative prototype states. They are not measured results.
Every recommendation is only as good as the record behind it.
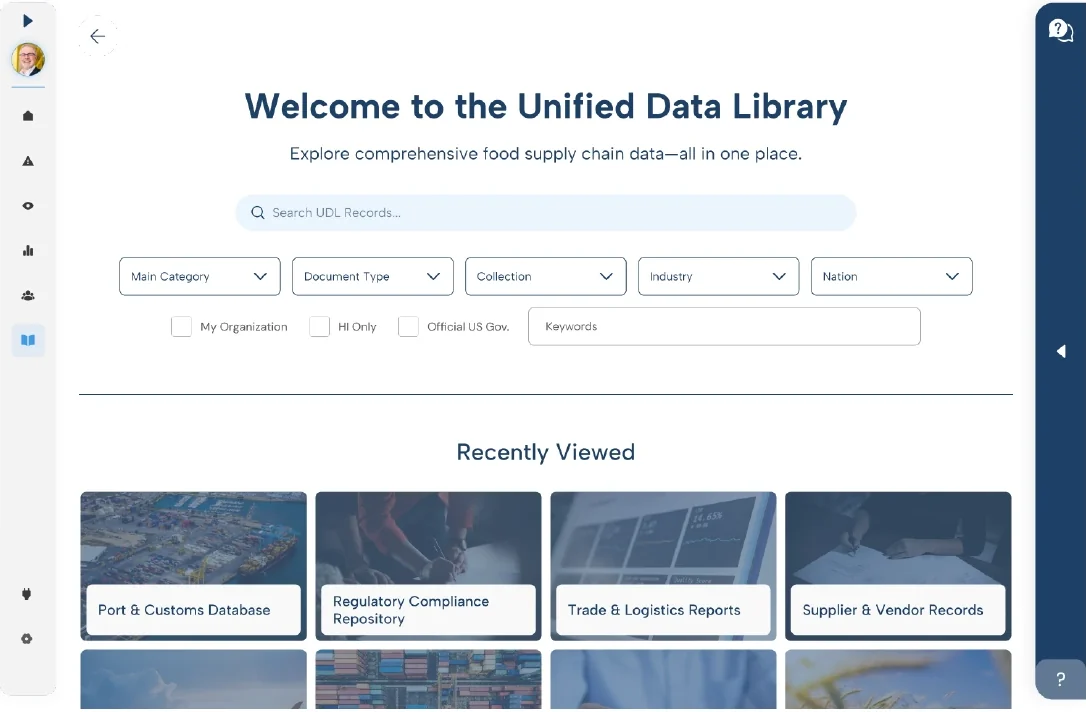
The library is the answer to “says who?”. It is searchable by category, document type, collection, industry and nation, scoped by what your organisation and your role are permitted to see, with recently viewed collections for the documents you live in.
Information architecture did most of the work here: features grouped under risk management, product tracking, business analytics, communication and the library itself, so a farmer and an inspector can both retrieve and contribute without learning someone else’s mental model.
Category, document type, collection, industry and nation — the filters follow how trade documents are actually organised.
My organisation, HI only, official US government. Access is part of the interface, not a surprise after you click.
A risk that nobody can act on together is just a notification.
The last stretch of the flow is a paperwork discrepancy found after customs clearance: the carrier will not release the goods, the consignee details and invoice need confirming, and last-mile delivery is about to slip.
The design decision is that the message arrives attached to the shipment and its record, with the response options in the same place — rather than as an email that starts a second, parallel investigation.
A named handler, the shipment it concerns, and what they need from you, in one view.
Hand it to the carrier directly or loop in the team. The decision happens where the evidence is.
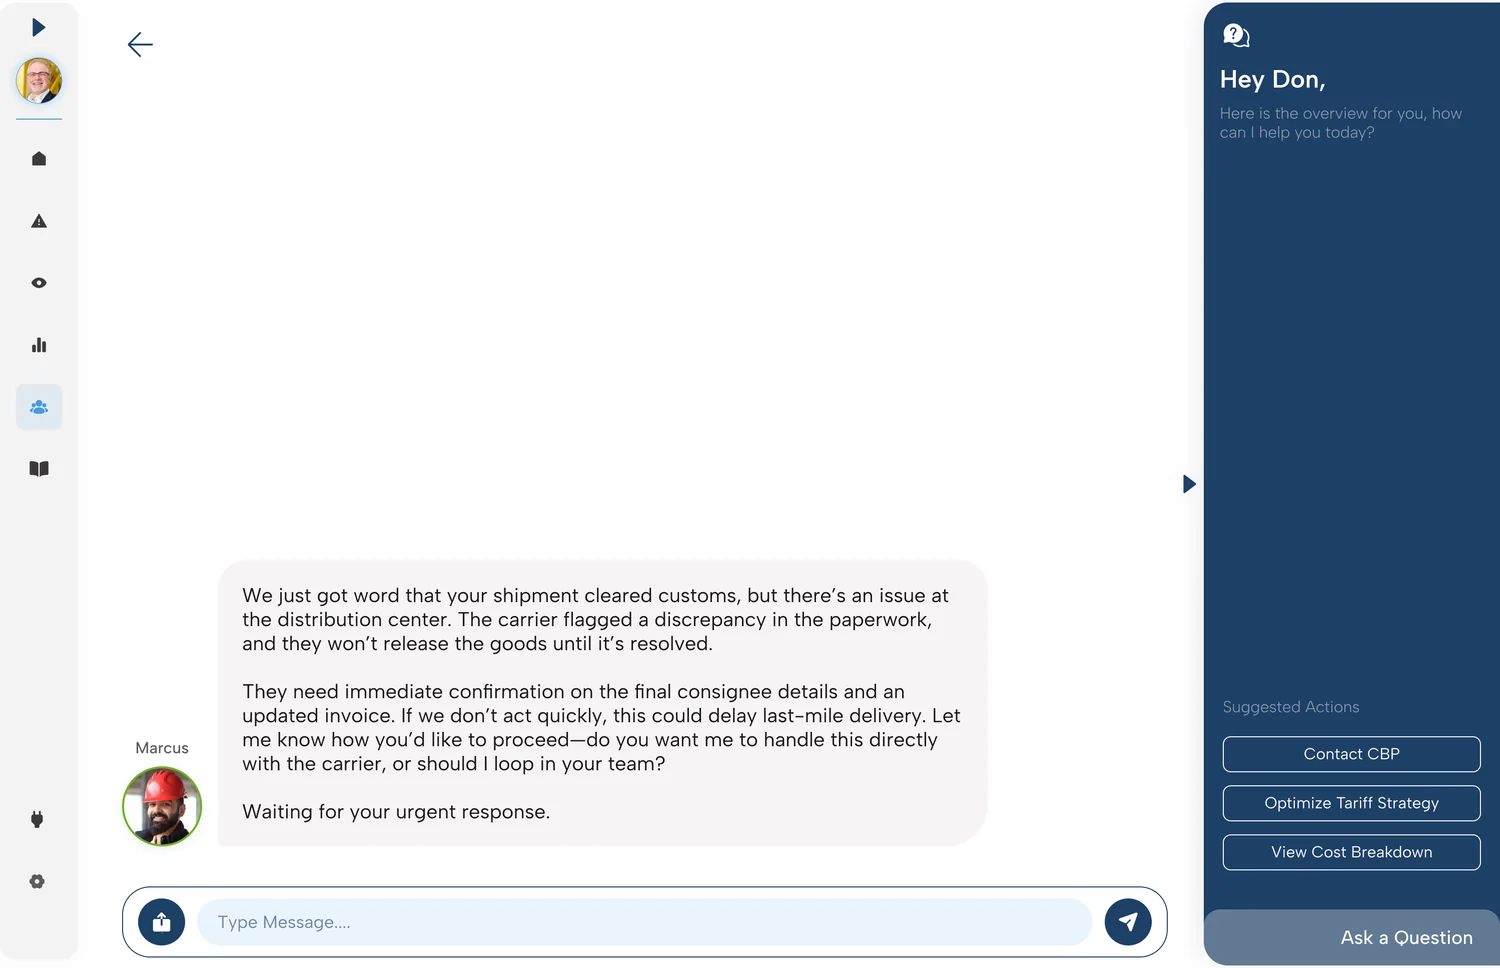
Notice → interpret → locate the record → choose an action → coordinate the handoff.
A record is only as honest as what feeds it.
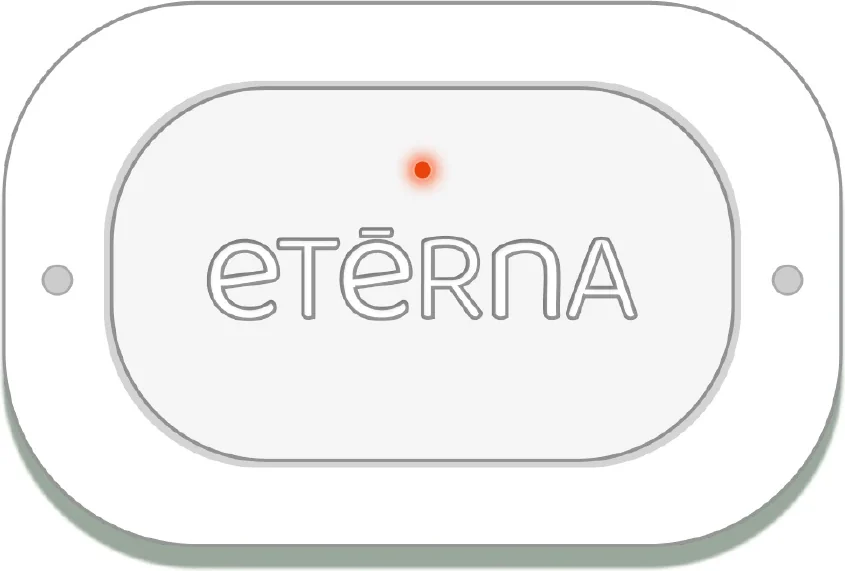
Etērna was prototyped as a reusable, low-cost tracking device — the physical contribution to the shared record, and an alternative to the traceability products already on the market.
We also built the argument in two other forms: a vision video to carry the scenario, and a digital twin in Unreal Engine 5 so stakeholders could explore what these interventions might mean across the system rather than on one screen.
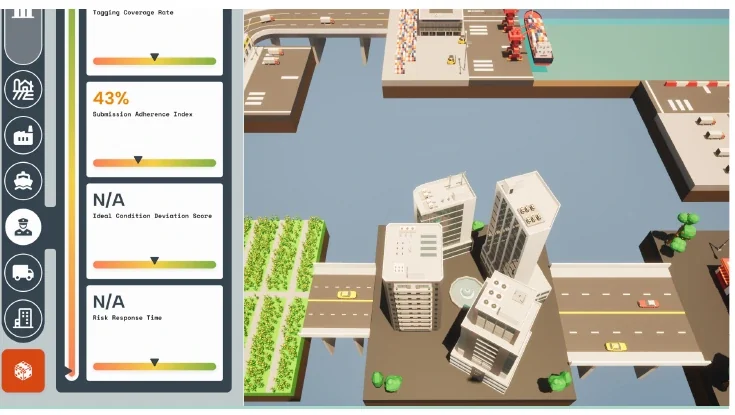
A researched, specified proposal — and an honest account of its edges.
We delivered the research and maps, the strategic direction, the UDL, PIE and SLICE interface concepts, the Etērna device concept, a vision video and the digital-twin demonstration. At the third checkpoint Deloitte asked us to push further into practical implementation, which is the right thing to have been asked.
What it is not: a deployed government system, a measured reduction in food loss, or a replacement for ACE. The five- and ten-year adoption descriptions in our book are proposals.
Stakeholder alignment with CBP, FDA and USDA on a feasible sequence. Task-based prototype testing with the people who would actually use it. Integration work against the systems that already exist. And operational measures — delay and loss — rather than the belief that a better interface implies them.
What I took from it: on a system this fragmented, the hardest design work is deciding where the truth lives. Everything downstream — the alert, the risk score, the action, the handoff — is only worth as much as the record it points at.
Team project for Deloitte through SCADpro, Winter 2025. Credited as a project manager; the deliverables were made by a multidisciplinary team across research, design, film and engineering. The orange shipment is an illustrative scenario. Prototype figures are illustrative states, and the roadmap is prospective.