The SDG Mandala UN SDG 9 · Industry, Innovation and Infrastructure
Turning interconnected sustainability challenges into a visual strategy for SDG 9.
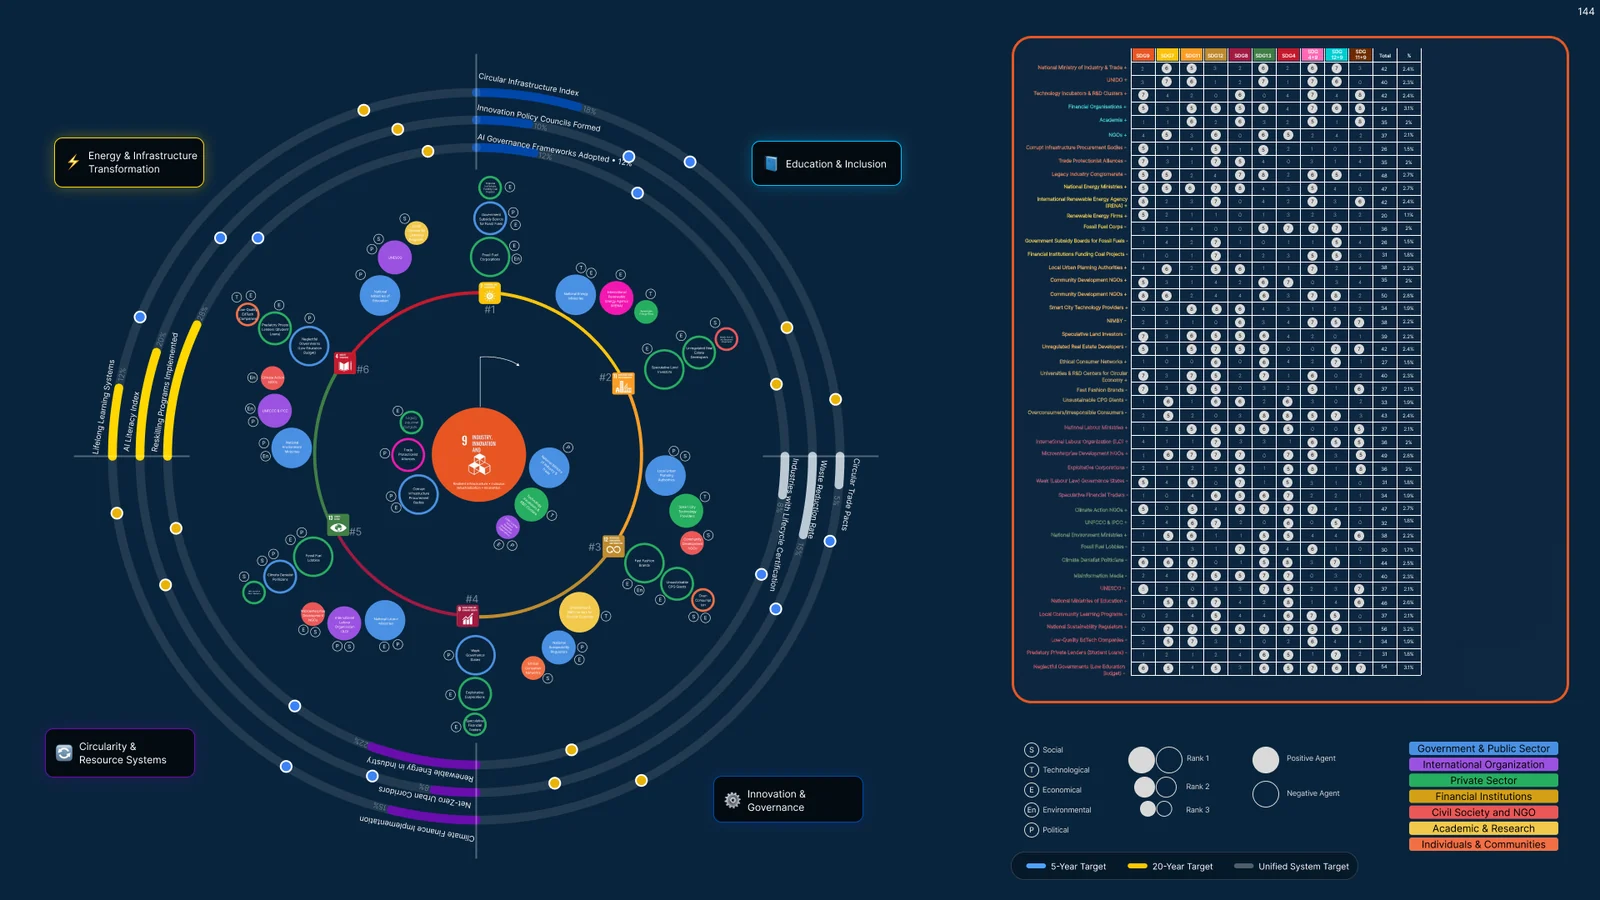
Complexity made legible. Six supporting goals, 46 modelled agents, four encodings on every mark and 1,756 interactions between them — held in one circular map that gains a layer at each stage and never stops being readable, until it can carry a strategy and report against it.
- Role
- Solo · research, systems mapping & visualisation
- Context
- SBIZ 750 · SCAD · Prof. Tom Hardy
- Scope
- SDG 9 and six supporting goals
- Output
- Evolving map, interaction matrix, strategy layer
The challenge: a goal you cannot hold in your head
SDG 9 asks for resilient infrastructure, inclusive industrialisation and innovation. Every word of that depends on other goals, other institutions and forces pulling in opposite directions. The brief was to get from that complexity to something a decision can be made against.
Rather than write the system down as a list, I drew it. One circular map, built in stages, where every stage adds exactly one kind of information and nothing already drawn is thrown away. The map is the argument: if it stays readable as it grows, the system has been understood.
The goal I chose, and the six that carry it
The Sustainable Development Goals are seventeen commitments every UN member state signed in 2015 — and they only work as a set. Pull on one and the others move, which is exactly why none of them can be planned for alone. That is the design problem I took on.
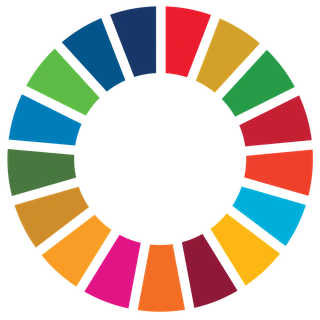


The brief put all seventeen on the table and asked each of us to take one. I took SDG 9 — Industry, Innovation and Infrastructure, because it is the goal I can argue about: industry, technology and the systems people actually build on. It is also the hardest to hold in one view, and that is what I wanted to solve.
I then argued SDG 9 down to the six goals that actually carry it. Each one earns its place for a reason, and that reasoning becomes the ring of the map:
 SDG 7Affordable and Clean EnergyEnergy is the substrate of industry: no clean power, no clean production.
 SDG 11Sustainable Cities and CommunitiesCities host the infrastructure, and city policy sets the pace of adoption.
 SDG 12Responsible Consumption and ProductionIndustry cannot be sustainable while its material loops stay open.
 SDG 8Decent Work and Economic GrowthIndustrialisation only counts if it converts into jobs and enterprise.
 SDG 13Climate ActionClimate shocks are what resilient infrastructure is resilient against.
 SDG 4Quality EducationInnovation runs on skills: STEM, design and research capacity.
Ranking what actually carries SDG 9
Six goals do the carrying: clean energy, sustainable cities, responsible consumption, decent work, climate action and quality education. I ranked them by how much each one determines progress on SDG 9, then placed them clockwise from the top in that order.
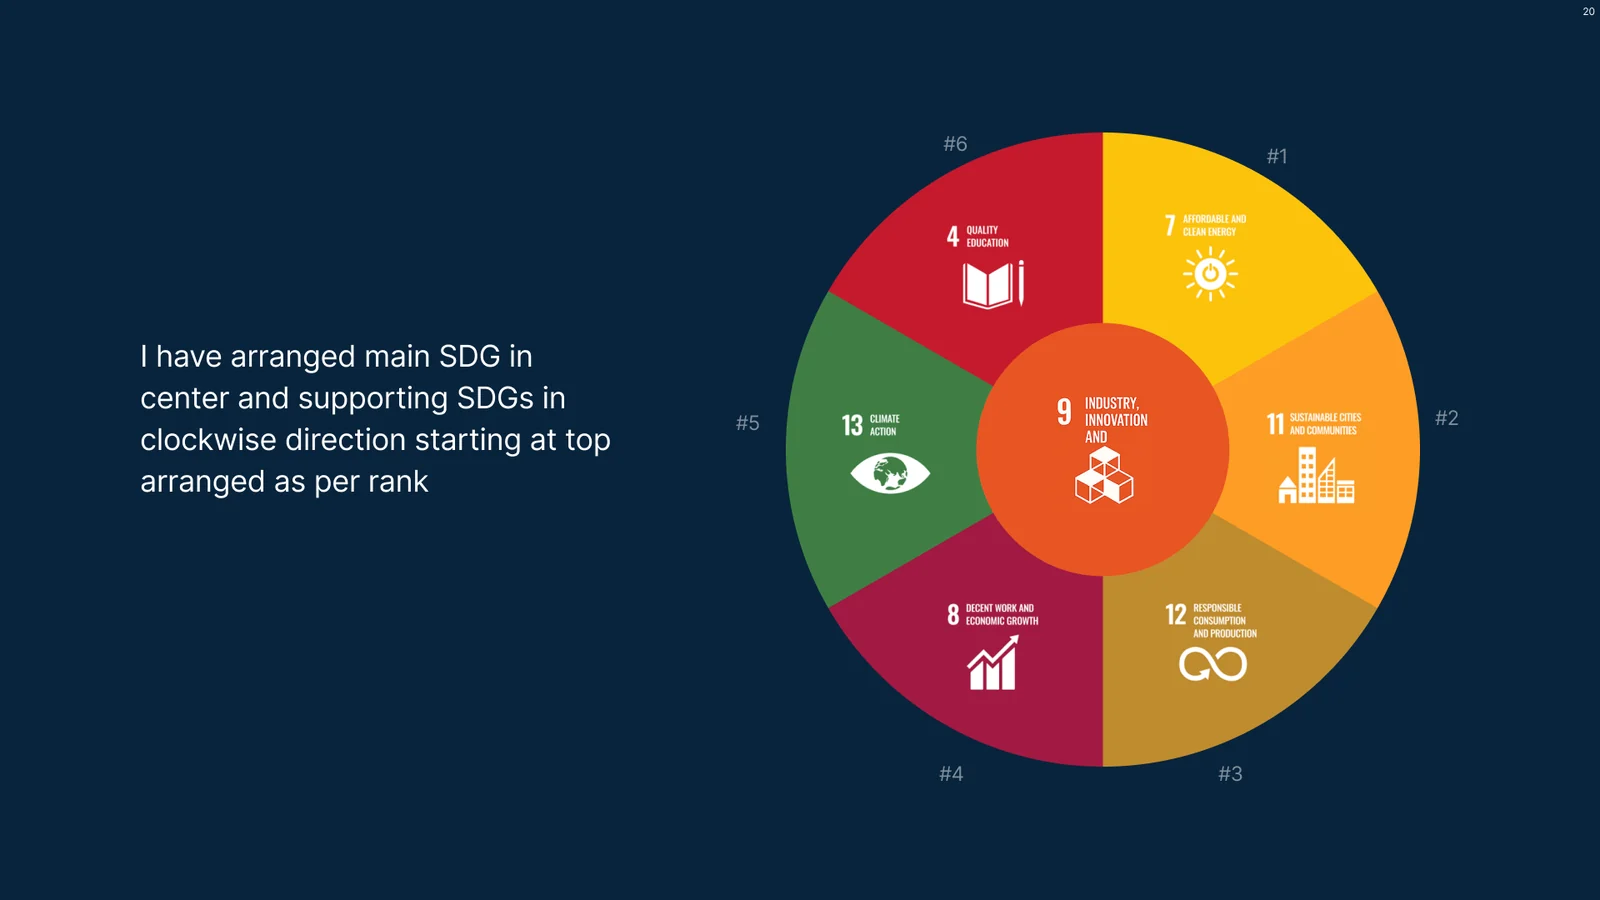
The ranking is a judgement made for this project, not a UN ordering. Fixing it early is what lets everything after it stay comparable: once a goal owns a wedge, every agent, force and interaction can be placed in relation to it.
Who moves it, and who holds it back
A goal does not act. Agents do — ministries, intergovernmental bodies, companies, financiers, universities, NGOs and communities. I added three enabling agents per goal, then three obstructing ones, and let the encoding carry the difference.
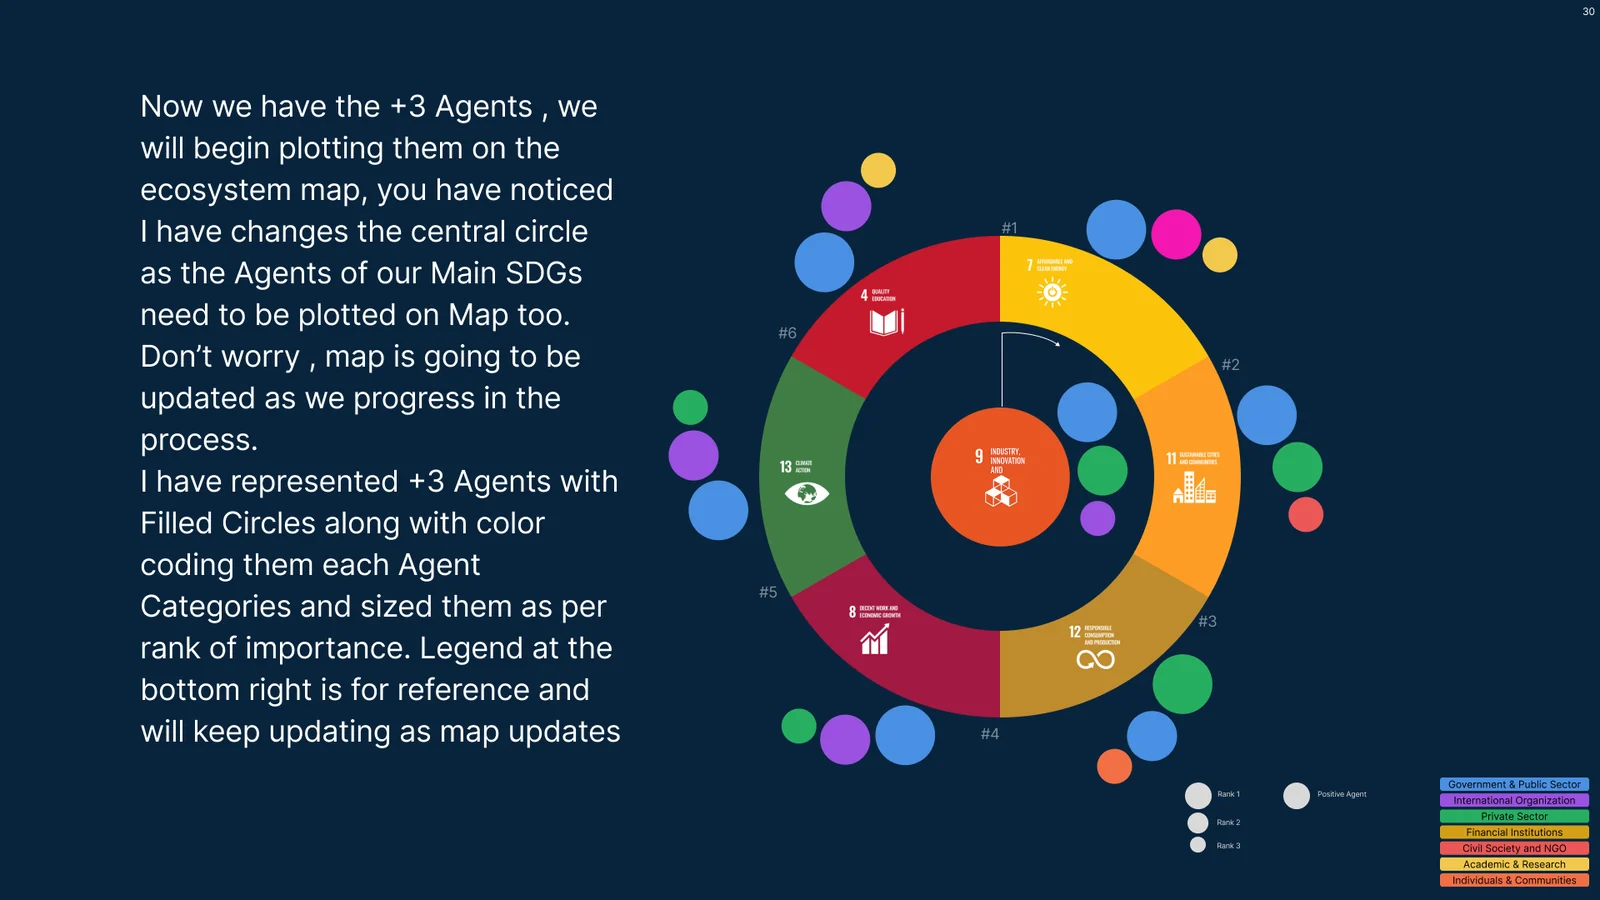
Then the other half of the truth. Obstructing agents — fossil-fuel corporations, weak labour protections, corrupt procurement bodies, predatory student lenders, cultural resistance — join the same map as outlined circles, on the same colour and size rules. These are roles modelled inside the project, not verdicts on whole sectors.
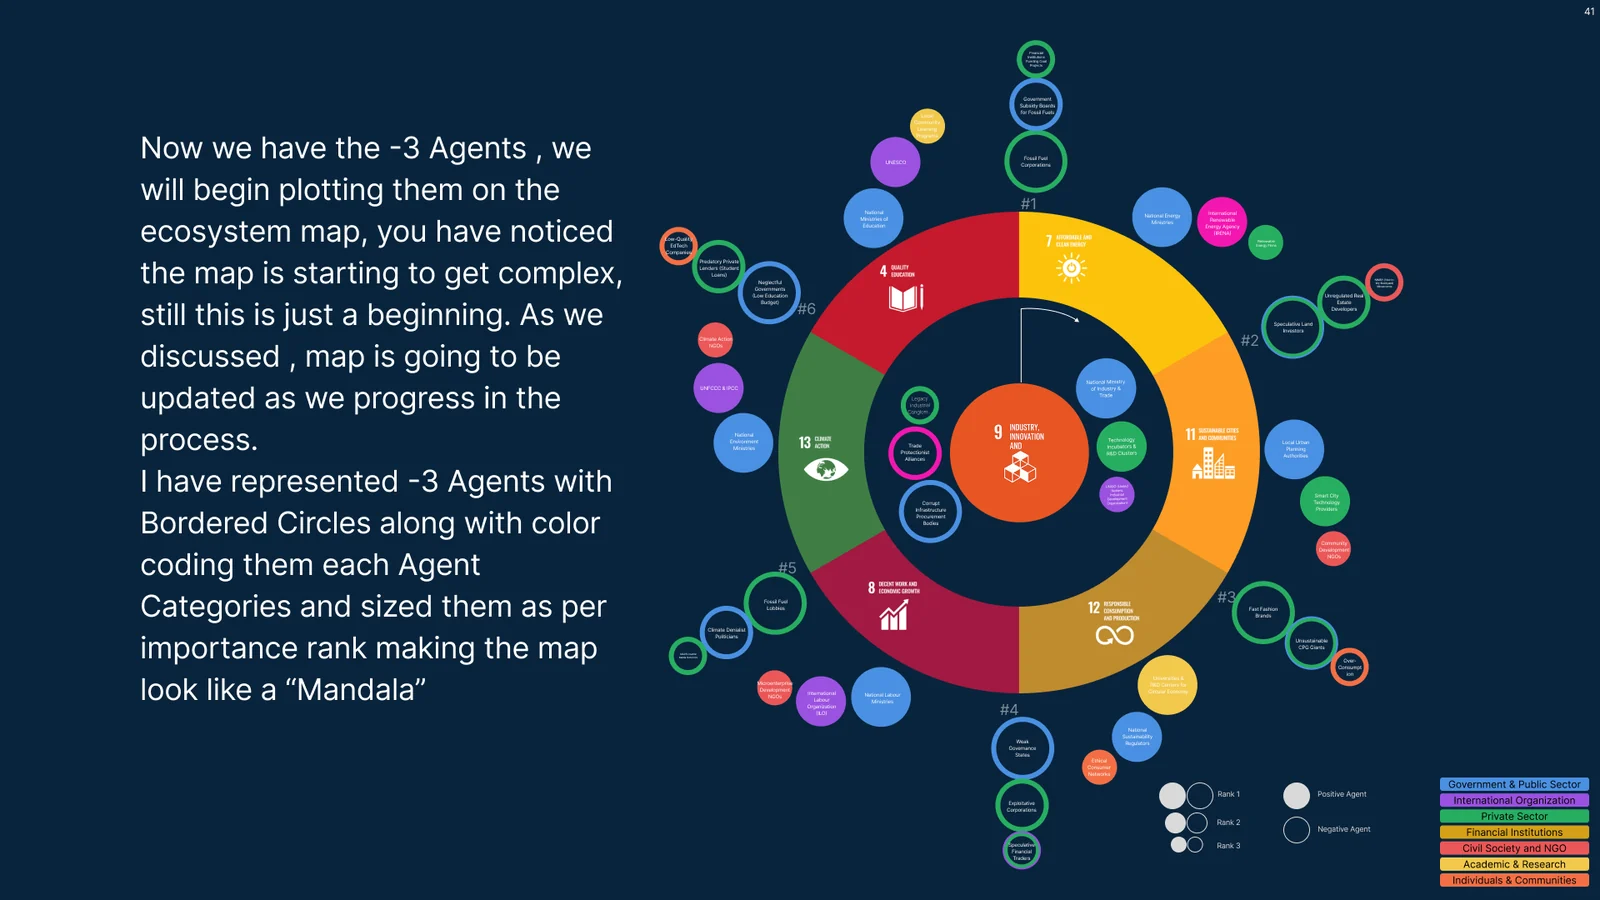
The name came from the form, not from theory: a dense, radial, symmetrical composition that still reads from the centre out. The geometry did change to earn it — the centre was reworked to hold SDG 9’s own agents, and the ring was thinned so the outer field had room.
What kind of force each agent is
Category tells you who an agent is. It does not tell you what kind of pressure they apply. Every agent was tagged Social, Technological, Economic, Environmental or Political, and the tag joined the map as a letter rather than a new colour, so the category encoding survived.
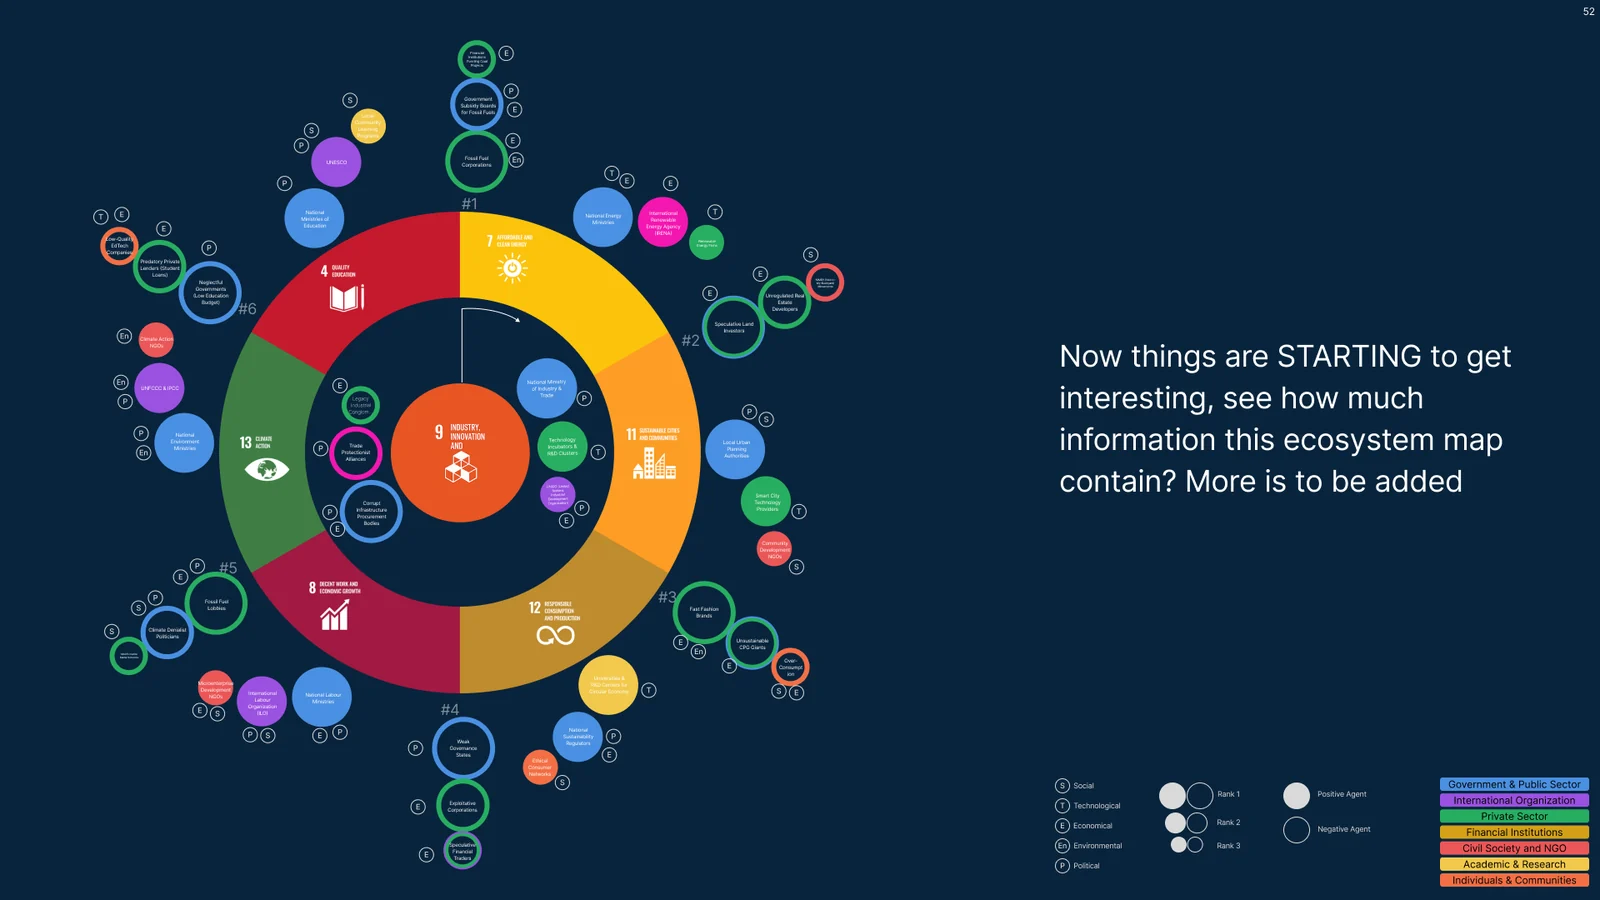
Four kinds of information now sit on one mark without fighting: category as colour, polarity as fill or outline, rank as size, force as a letter. That restraint is what keeps the next layer possible.
1,756 interactions, counted
A map of agents still only shows who is present. The interaction matrix asks what happens between them: every agent on both axes, each cell coloured by the goals that the relationship touches, black down the diagonal for self-interaction, blank where the relationship is negligible.
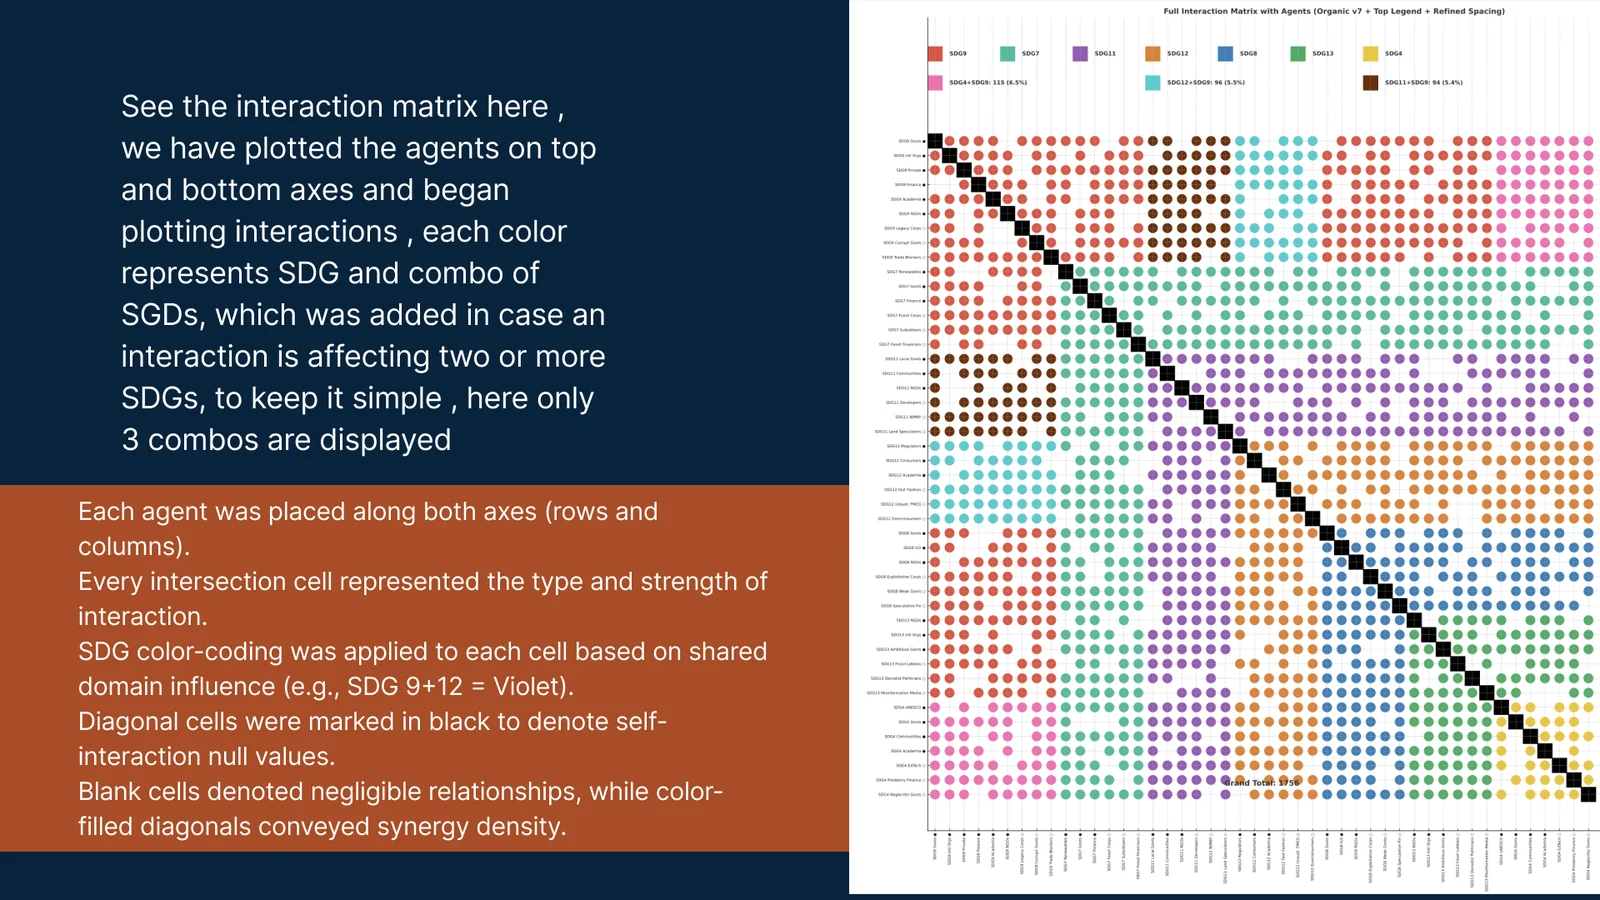
Counted across the model, that comes to 1,756 recorded interactions, with a per-agent share of the total. It is a count of what the model represents, not a measurement of the world: both axes hold the same agents, and connections involving blockers are counted too. What it buys is a way to see where the system is dense and where it is thin.
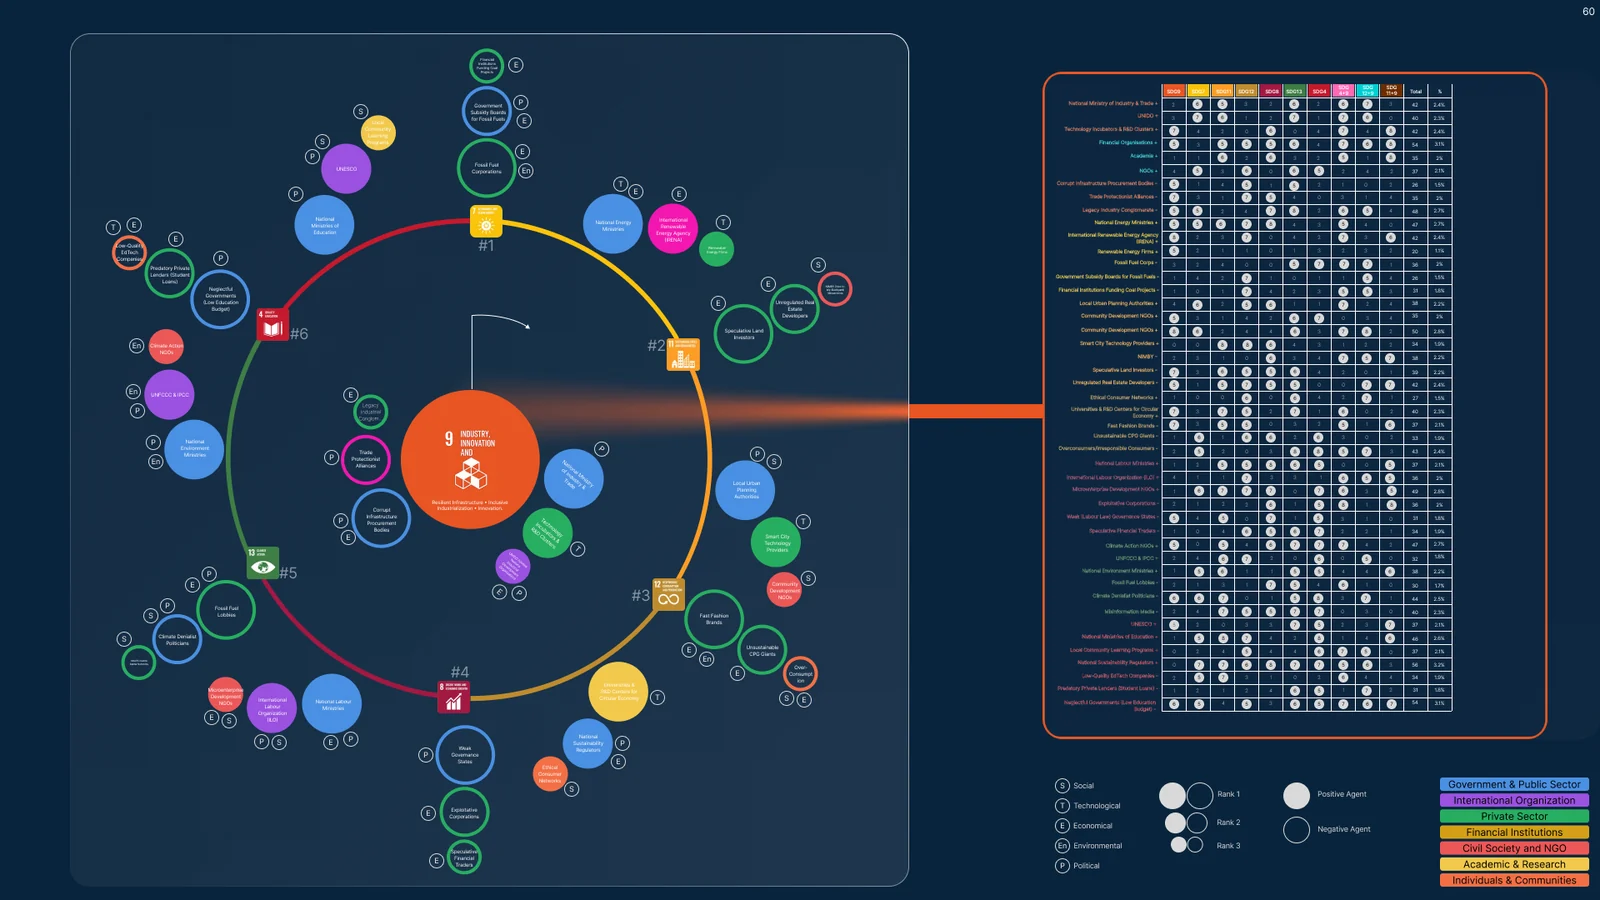
Method note: 46 agent entries are recorded in the matrix (SDG 9 has nine; five goals have six each; education has seven). Entries are roles and modelled conditions, not a census of organisations. Counts come from the full matrix and its summary; later compact tables in the book differ on some rows.
From implication to response
Density is not insight until it says what follows. Each part of the system was read forward into implications at five and twenty years, positive and negative, and every implication was answered with a response that leverages it or reverses it.
- ProblemInstitutional inefficiency and legacy industrial practice slow sustainable innovation.
- AgentsIndustry ministries, UNIDO, R&D clusters, procurement bodies — and the legacy interests pulling the other way.
- ImplicationWeak coordination and opaque procurement slow how fast innovation spreads.
- ResponseCoordinated cross-sector R&D, transparent digital procurement, modernisation frameworks.
A second chain keeps it honest, because not every gain is free: automation raises industrial capability while widening exclusion, so the response pairs it with reskilling and education. The map is useful precisely when it shows a trade-off rather than a win.
Strategy, drawn as rings
Responses were prioritised into strategic steps, each with the agents who would carry it and a horizon to carry it by. Then the strategy went back into the map: four pillars — Innovation & Governance, Circularity & Resource Systems, Energy & Infrastructure Transformation, Education & Inclusion — drawn as concentric arcs around the Mandala, a form borrowed from Apple Watch activity rings.
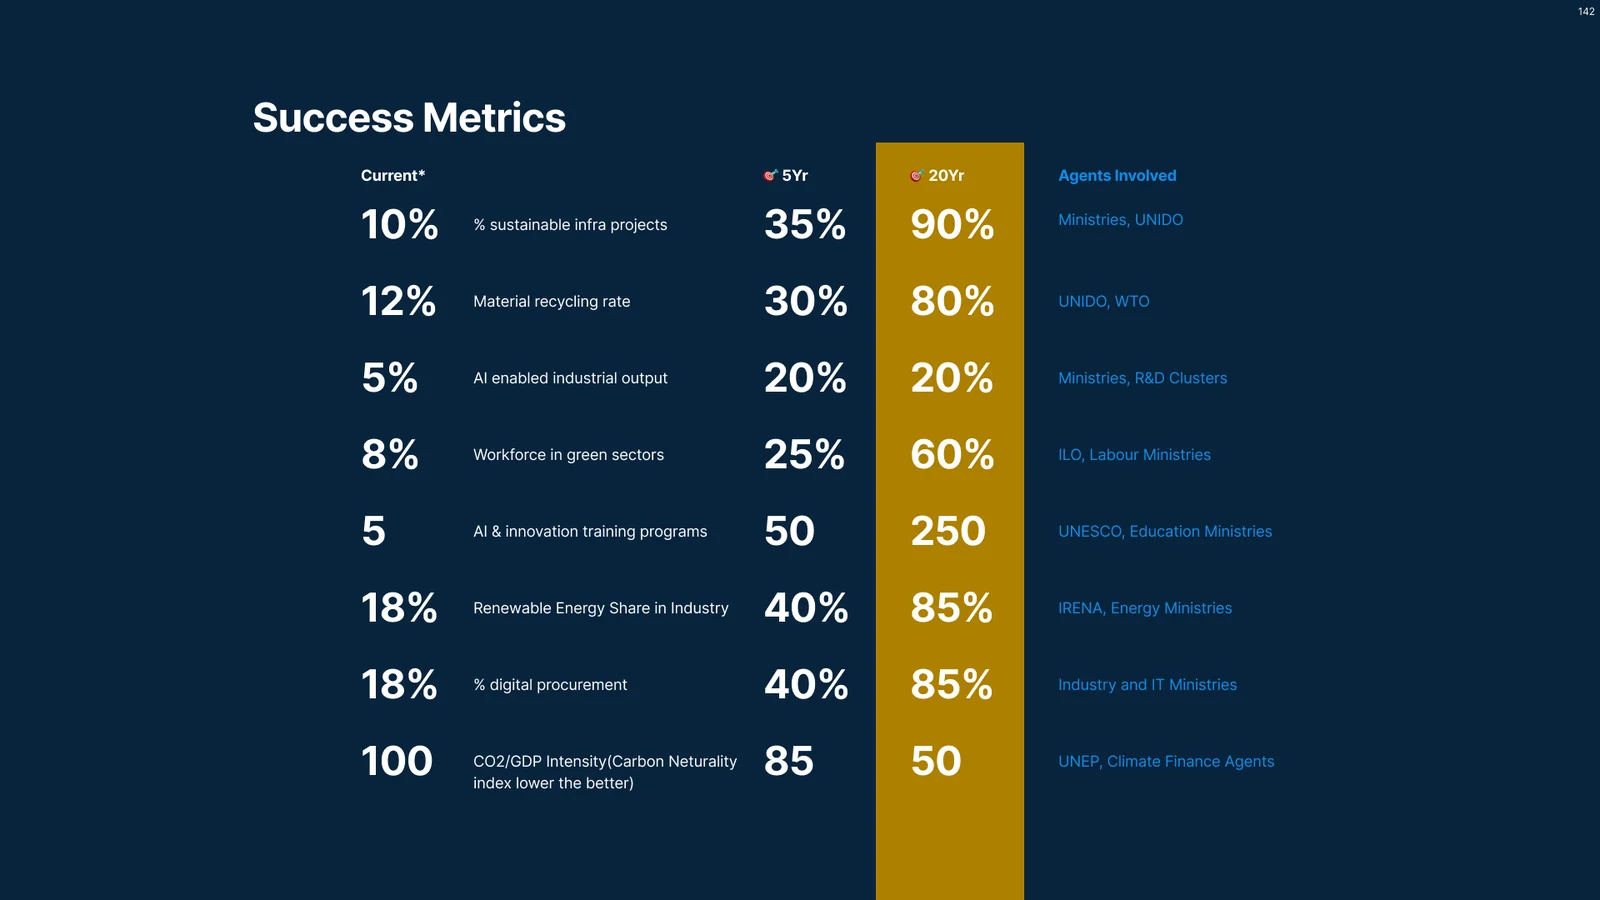
| Measure | Baseline* | 5 years | 20 years |
|---|---|---|---|
| Sustainable infrastructure projects | 10% | 35% | 90% |
| Material recycling rate | 12% | 30% | 80% |
| AI-enabled industrial output | 5% | 20% | 20% |
| Workforce in green sectors | 8% | 25% | 60% |
| AI and innovation training programmes | 5 | 50 | 250 |
| Renewable energy share in industry | 18% | 40% | 85% |
| Digital procurement | 18% | 40% | 85% |
| CO₂ / GDP intensity index (lower is better) | 100 | 85 | 50 |
The rings are the concept, shown as drawn: how a system map becomes a dashboard without becoming a different object. What each arc length reports — baseline, progress, or horizon — is not yet specified tightly enough to read as a live instrument.
What the map is, and what it is not
It is a way of thinking made visible: a sustainability system that can be argued with, because you can point at the part you disagree with. Eight stages, one drawing, four encodings and a counted model underneath it.
Scope and honesty: this is academic work for SBIZ 750 at SCAD. It was not deployed, adopted or tested with decision-makers, and the institutions named are agents inside the analysis, not clients or partners. Interaction counts describe the model; baselines are its assumptions; targets are scenario targets. The reasoning and the visual system are the work. SDG icons, logo and wheel: United Nations communications material, emblem-free version; not a UN publication.
As a method it is finished; as a product it is not. The next version turns the stages into something that can be re-run for another goal — a tool where the ring, the agents and the matrix are inputs rather than artwork.